STEEP Analysis: How to Scan the Forces Shaping Your Future
Read this page in: Français · Español · Português · Deutsch · Nederlands · Italiano · 日本語 · 한국어 · Bahasa Indonesia · Polski · Čeština · Svenska · Dansk · Norsk (bokmål) · Suomi · Ελληνικά · Türkçe · Eesti
STEEP analysis is a checklist of five fields, Society, Technology, Economics, Ecology, and Politics, used to make sure a study of the future looks beyond the edges of your own industry. It is the first tool most futurists reach for and one of the simplest. Its job is to stop a team from studying only the things it already knows how to study.
At a glance
- What it stands for: Society, Technology, Economics, Ecology, and Politics.
- What it does: forces a scan of trends in all five fields, so that social, environmental, and political change gets the same attention as technology and markets.
- Where it came from: the environmental scanning tradition in business strategy, usually traced to Francis Aguilar’s 1967 book Scanning the Business Environment. PEST and PESTLE are close relatives.
- Where it fits: at the very start of a foresight project, to decide what to research, and again near the end, to work out what the findings mean.
- How long it takes: a first pass takes an afternoon. The research it points you toward takes weeks.
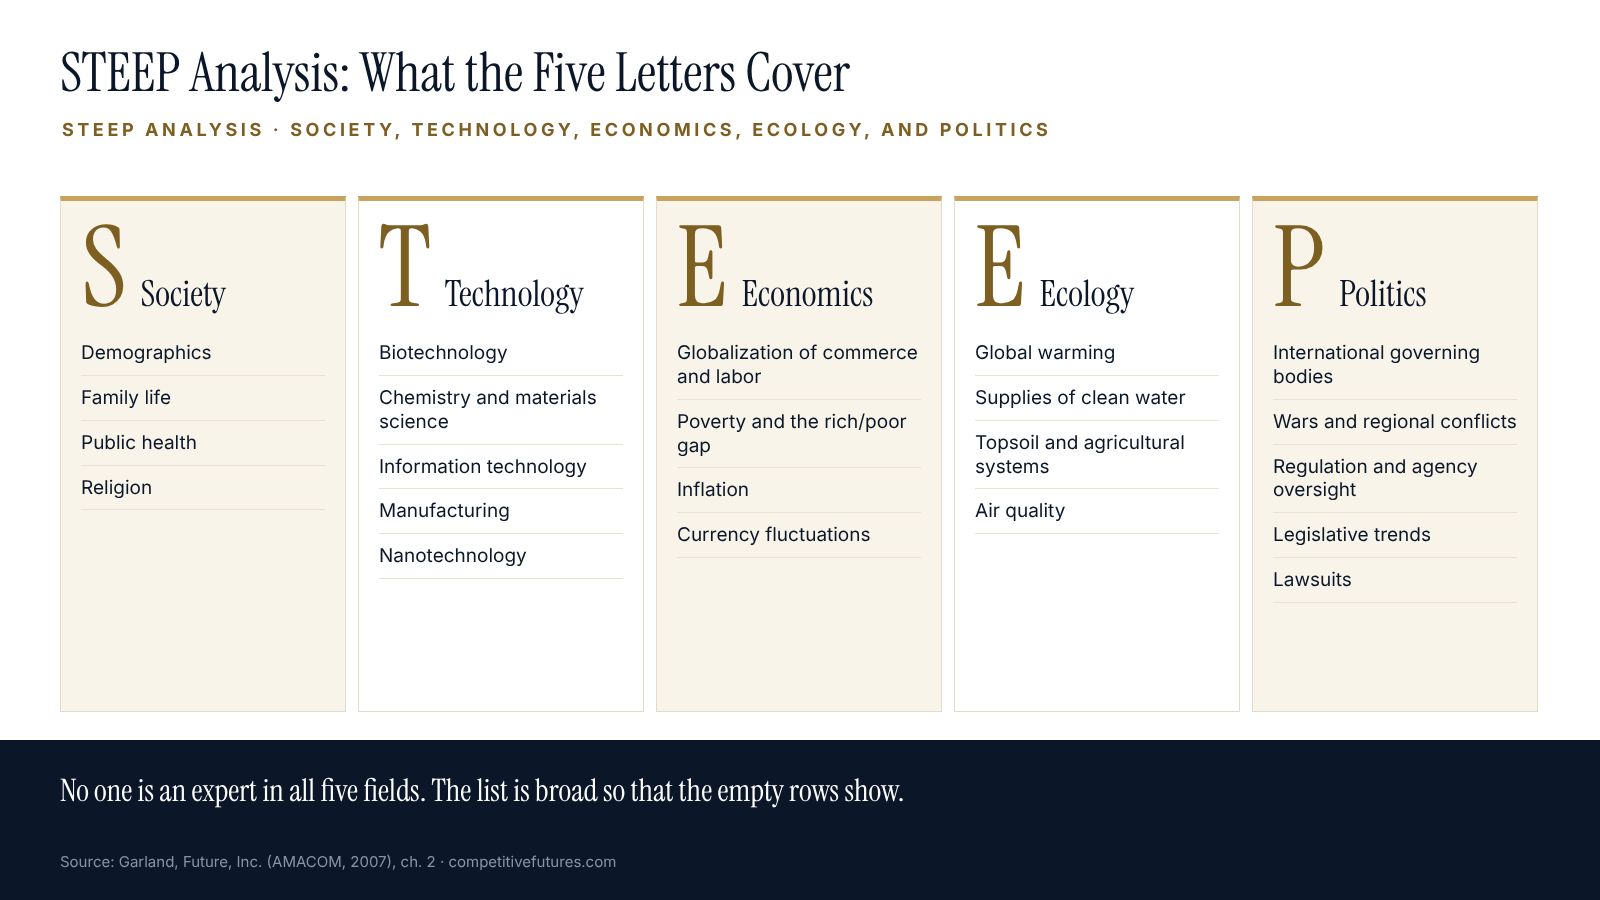
What the five letters cover
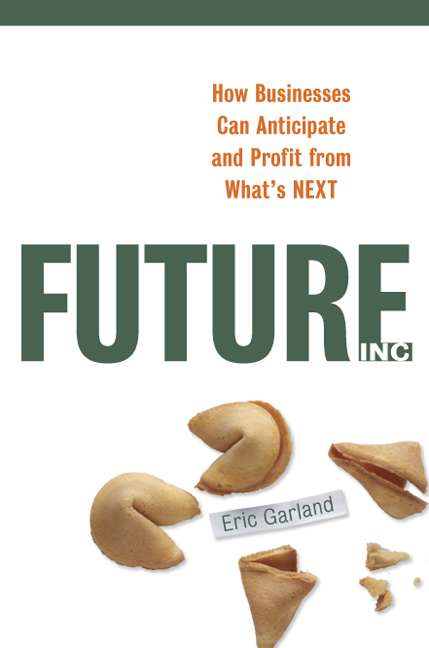
In Future, Inc. (AMACOM, 2007) I introduced STEEP as “one of the most basic tools futurists have,” and added that it might not be famous unless you are a professional futurist. Here is what each letter takes in, with the examples from the book.
- Society: demographics, family life, public health, and religion.
- Technology: biotechnology, chemistry and materials science, information technology, manufacturing, and nanotechnology.
- Economics: globalization of commerce and labor, poverty and the gap between rich and poor, inflation, and currency fluctuations.
- Ecology: global warming, supplies of clean water, topsoil and agricultural systems, and air quality.
- Politics: international governing bodies, wars and regional conflicts, government regulation and agency oversight, legislative trends, and lawsuits.
The list is broad on purpose. As I wrote in the book, “No one on earth is simultaneously an expert in each of these five categories, and the very broadness of each of these terms will make you think about subjects outside your own industry and area of expertise.”
That is the whole mechanism. An engineer left alone will fill the technology row. A finance team will fill economics. STEEP makes the empty rows visible.
Where STEEP came from, and how it differs from PEST and PESTLE
The idea of scanning the outside world by category comes from business strategy. The usual starting point is Francis J. Aguilar of Harvard Business School, whose 1967 book Scanning the Business Environment sorted the outside world into four sectors: economic, technical, political, and social. Later writers rearranged and extended the letters.
| Framework | Categories | Notes |
|---|---|---|
| ETPS (Aguilar, 1967) | Economic, Technical, Political, Social | The original four sectors. |
| PEST | Political, Economic, Social, Technological | The same four, reordered. Common in marketing textbooks. |
| STEEP | Society, Technology, Economics, Ecology, Politics | Adds the natural environment as its own field. The futurist’s default. |
| PESTLE | Political, Economic, Social, Technological, Legal, Environmental | Splits law out from politics. Used in UK government foresight work and common in business teaching. |
The differences matter less than people think. The UK Government Office for Science teaches PESTLE in its Futures Toolkit and tells facilitators they may use “any alternative approaches” that suit the project. In the STEEP I use, regulation, legislation, and litigation all sit under Politics, so nothing in PESTLE’s “Legal” is lost.
Pick one framework and use it every time. Consistency lets you compare one study with the next.
A worked example: the future of chocolate
In the book I asked readers to picture a chocolate bar and then answer a question: what is the future of chocolate bars? It contains no computer chips. Nobody is rushing a new version to market. It looks like a product without a future to study.
Then run it through STEEP and ask what applies.
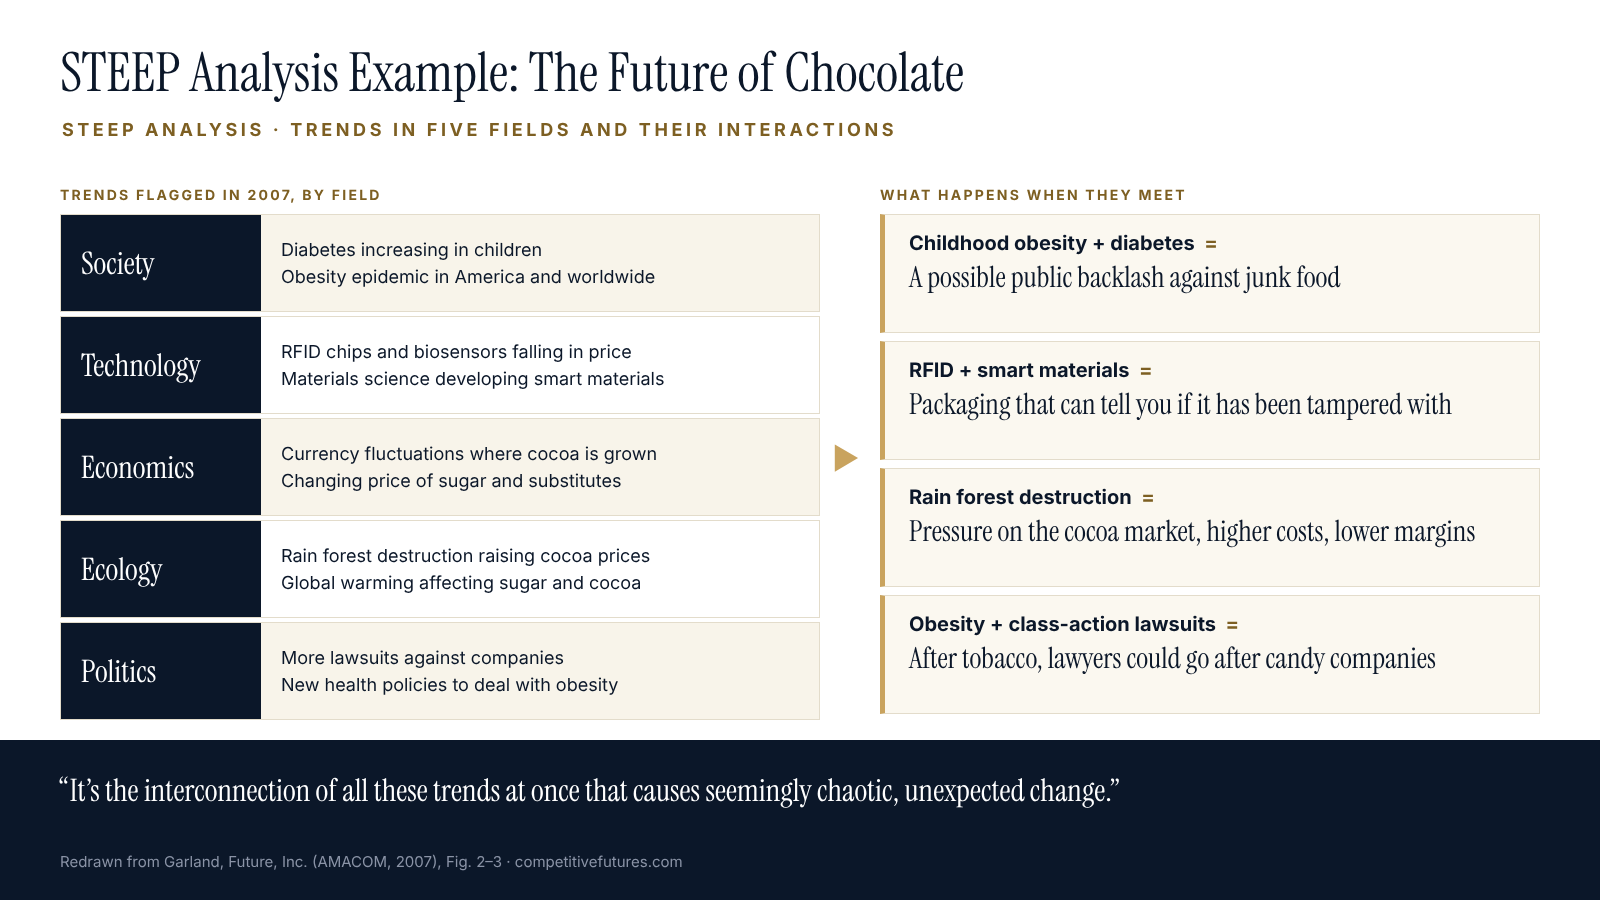
| Field | Trends flagged for chocolate in Future, Inc. (2007) |
|---|---|
| Society | Diabetes increasing in children; an obesity epidemic in America and around the world |
| Technology | Radio-frequency ID chips and biosensors for packaging falling in price; materials science developing smart materials |
| Economics | Currency fluctuations in the countries where cocoa is grown; changing prices of sugar and sugar substitutes |
| Ecology | Destruction of rain forest raising the price of cocoa; global warming affecting how sugar and cocoa grow |
| Politics | More lawsuits against companies; new health policies to deal with obesity |
The grid is the easy half. The value comes from what the book called the interconnection of the trends:
- Childhood obesity + diabetes = a possible public backlash against junk food.
- RFID + smart materials = packaging that can tell you whether it has been tampered with.
- Rain forest destruction = pressure on the international cocoa market, higher costs, and lower margins.
- Obesity + more class-action lawsuits = after the tobacco settlements, lawyers could go after candy companies.
As I put it then, “It’s the interconnection of all these trends at once that causes seemingly chaotic, unexpected change.” A chocolate bar turned out to sit in the middle of public health, materials science, commodity markets, tropical ecology, and litigation.
How the chocolate grid aged
Two rows of that 2007 grid have since produced events a candy maker could not ignore.
- Politics and ecology. In 2023 the European Union adopted its regulation on deforestation-free products. Cocoa is one of seven commodities it covers, and chocolate is among the products derived from them.
- Ecology and economics. In December 2024, New York cocoa futures set a record above $12,000 a tonne. The International Cocoa Organization’s market report for that month cited severe dryness in the top producing countries.
The grid did not predict either event. It did put ecology and politics on a chocolate company’s reading list years before they reached the cost of goods, which is the most a scanning tool can do. The book’s own conclusion still holds: “if change can happen to chocolate, it can happen to you.”
The grid also had a gap. Nothing in my 2007 example mentions child labor on cocoa farms. The issue was already on the public record: in September 2001 the chocolate and cocoa industry signed the Harkin-Engel Protocol, a commitment to eliminate the worst forms of child labor in cocoa growing. A survey funded by the U.S. Department of Labor and carried out by NORC at the University of Chicago later estimated that about 1.56 million children were in child labor in cocoa production in Côte d’Ivoire and Ghana in the 2018–19 season. I came to the subject afterward, through my work on human trafficking. It belongs in the Society row of any chocolate grid drawn today, and it is a reminder that a grid filled in by one person has that person’s blind spots.
How to run a STEEP analysis
- Name the subject. A product, a market, a policy, or a decision. Be specific. “Our business” is too large. “Chocolate bars sold in North America” works.
- Read down the five lists. For each field, write every trend that might touch the subject. Do not filter yet.
- Determine relevance. Ask which items could change who your customers are, what your product costs, what the law allows, or what your competitors can do. Cut the rest.
- Research the trends at the source. A trend on a sticky note is a guess. Find the original data behind each one. Our trend analysis guide covers how.
- Connect them. Take the trends in pairs and write what happens when they meet. For a small set, do it by hand. For a large one, use a cross-impact matrix.
- Draw the system. STEEP tells you what to look at. A systems map shows how the pieces act on each other. In the book I was direct about the limits of this stage: “The point of systems thinking is not to discover the future; it is to provide a starting point for the coming work.”
- Come back to STEEP at the end. When the research is done, use the five fields again to interpret it.
STEEP as a filter for implications
Step 7 is the half of STEEP that most guides leave out. When a study turns up something large, the natural reaction is “this changes everything.” That is no help to a planning team. In chapter 5 of Future, Inc. I recommended running each major finding back through the five fields as questions:
- Society: Will this affect people? What about family structure? Will work life change?
- Technology: Does this imply a new technology will become available? Will it eclipse an existing one? How will R&D need to react?
- Economics: Will this change most businesses? Will governments need to alter fiscal policy? Will consumers act differently?
- Ecology: What are the implications for the natural systems that support us? Will this cause a new stress?
- Politics: How will this change governance? Will new groups begin to exert force on the government?
Used this way, STEEP turns one finding into a structured set of second-order effects.
Common mistakes
- Filling in only T and E. In How to Predict the Future…and WIN! (2011), Tip 11 from the fictional Dr. Egon is “Rely On Technology And Business, Ignore Culture, Society, Philosophy.” My answer in that book: “The future is defined by far more than business alone.” If your grid’s society and politics rows are thin, you have found your blind spot.
- Stopping at the list. Five columns of trends is an inventory. The insight is in the interactions.
- Using one country’s sources. A STEEP scan built from one nation’s press inherits that nation’s assumptions. See our guide to foreign-language OSINT.
- Writing headlines instead of trends. “AI” is a headline. A trend is a measurable change over time with a source attached.
- Doing it once. The fields do not change. What is in them does.
What STEEP teaches about building an intelligence function
A STEEP grid is also an organization chart for a scanning team. Assign each field to a person or a small group, and you have guaranteed that somebody reads outside the industry press every week. The assignment matters more than the talent. Most organizations already employ people who follow politics, demographics, or environmental regulation out of personal interest. Few have told them it is part of the job.
Three practices make the difference. Give every field an owner. Review the grid on a fixed schedule, not when a crisis prompts it. And require that every item carry a source and a date, so that the next review can see what moved.
Frequently asked questions
What does STEEP stand for?
Society, Technology, Economics, Ecology, and Politics. Some authors write Social, Technological, Economic, Environmental, and Political. The five fields are the same.
What is the difference between STEEP and PESTLE?
PESTLE adds Legal as a sixth category and calls the natural environment “Environmental.” STEEP keeps law inside Politics. Both descend from the same environmental scanning tradition, and either will work if you use it consistently.
Who invented STEEP analysis?
No single person. The approach is usually traced to Francis Aguilar’s 1967 book Scanning the Business Environment, which used four categories. Later writers added ecology as a fifth.
When should I use STEEP analysis?
At the start of any foresight, strategy, or market-entry project, to decide what to research, and again at the end, to interpret what you found.
Is STEEP analysis the same as SWOT?
No. STEEP scans the outside world. SWOT sorts what you know into strengths, weaknesses, opportunities, and threats. A good STEEP scan supplies the opportunities and threats that a SWOT needs.
How long does a STEEP analysis take?
A first pass with a small group takes two to four hours. Researching the trends it surfaces, and working out how they interact, is the real project and can take weeks.
Work with Competitive Futures
Competitive Futures runs environmental scans and foresight projects for companies and governments, and trains teams to do their own. If your organization wants a view of the forces outside its industry, contact the company.
Related reading
- Systems Mapping
- Trend Analysis
- Cross-Impact Analysis
- The Futures Wheel
- Second-Order Effects
- 25 Foresight Mistakes
References
- Garland, Eric. Future, Inc.: How Businesses Can Anticipate and Profit from What’s Next. New York: AMACOM, 2007. Chapter 2, “Systems Thinking,” and chapter 5, “Strategic Implications.”
- Garland, Eric. How to Predict the Future…and WIN! Wallingford Press, 2011. Tip 11.
- Aguilar, Francis J. Scanning the Business Environment. New York: Macmillan, 1967.
- Government Office for Science (UK). The Futures Toolkit, 2nd edition, 2024, and “Driver Mapping: Facilitation Worksheet,” 29 August 2024. https://assets.publishing.service.gov.uk/media/66c4493f057d859c0e8fa778/futures-toolkit-edition-2.pdf and https://www.gov.uk/government/publications/driver-mapping-facilitation-worksheet/driver-mapping-facilitation-worksheet
- Regulation (EU) 2023/1115 of the European Parliament and of the Council of 31 May 2023 on deforestation-free products. https://eur-lex.europa.eu/eli/reg/2023/1115/oj
- International Cocoa Organization. Cocoa Market Report, December 2024. https://icco.org/wp-content/uploads/Cocoa-Market-Report-December-2024.pdf
- “Protocol for the Growing and Processing of Cocoa Beans and Their Derivative Products” (Harkin-Engel Protocol), September 2001. https://cocoainitiative.org/knowledge-hub/resources/harkin-engel-protocol
- NORC at the University of Chicago. Assessing Progress in Reducing Child Labor in Cocoa Production in Cocoa Growing Areas of Côte d’Ivoire and Ghana. Final report for the U.S. Department of Labor, October 2020. Summary: https://www.dol.gov/sites/dolgov/files/ILAB/Cocoa%20Webinar%20-%20Final.pdf
Part of the Strategic Foresight guide from Competitive Futures.