Cross-Impact Analysis: How to Build a Cross-Impact Matrix
Read this page in: Français · Español · Português · Deutsch · Nederlands · Italiano · 日本語 · 한국어 · 简体中文 · Bahasa Indonesia · Polski · Čeština · Svenska · Dansk · Norsk (bokmål) · Suomi · Ελληνικά · Türkçe · Eesti
Cross-impact analysis is the discipline of testing every trend in a study against every other trend, one pair at a time, to find out which combinations matter. Most strategy teams can name the five or ten forces reshaping their market. Few have asked what happens when two of those forces hit at once. The cross-impact matrix makes you ask, for every pair, and it is where the most surprising findings in a foresight project usually come from.
At a glance
- What it is: a grid with the same trends, events, or forecasts listed down the side and across the top. Each cell records whether the row item makes the column item more likely, less likely, or leaves it alone.
- Who invented it: Theodore J. Gordon and Olaf Helmer, while designing a forecasting game called Future for Kaiser Aluminum & Chemical Corporation in 1966. Gordon and Howard Hayward published the first computer version in the journal Futures in 1968.
- What it is for: finding interactions between trends that nobody assigned to watch, and checking whether a set of scenarios hangs together.
- How long it takes: a 6-by-6 grid is 30 pairs and fits in an afternoon. A 20-by-20 grid is 380 pairs and needs a team and several sessions.
- Where it fits: after you have collected trends and evaluated forecasts, and before you build scenarios. It is the many-trend partner of the Futures Wheel, which follows one change outward.
What cross-impact analysis does
Every foresight project produces a list. Aging populations, cheaper sensors, new regulation, a shortage of skilled labor, a shift in consumer values. The list is the easy part. The hard part, as I wrote in Future, Inc. (AMACOM, 2007), is that implications are not obvious until all the information is together and “superconnected.” People track trends one at a time, in separate departments and separate reports. The threats and opportunities sit in the spaces between them.
Cross-impact analysis is a way of filling those spaces on purpose. In the book I described it as a chart that “makes you check every trend, forecast, or wild-card against every other one uncovered in the course of your analysis.” My example was the future of cereal production, with three trends: rising computer processing power, the globalization of grain production, and an aging population. The grid forces three questions. What happens when processing power meets global grain production? When processing power meets an aging population? When global production meets an aging population?
Some pairs produce nothing. Retirees and wheat in Mongolia look like a dead end until you ask whether retirees could run high-tech farms. That is the point. The future is usually stranger than we expect it to be, so it pays to start with odd combinations, and the matrix is the only tool I know that guarantees you will look at all of them.
Where the method came from
Cross-impact analysis grew out of the same RAND circle that produced the Delphi method. Delphi gathers expert judgments about whether individual events will happen. Its weakness is that it treats each event as if it lived alone. Gordon’s question was whether forecasting could instead be built on how future events interact.
The first answer was a board game. In 1966 Kaiser Aluminum commissioned a future-oriented game for its twentieth anniversary, and Gordon, Helmer, and Hans Goldschmidt designed Future. Developments in technology and society were decided by probabilities and a special die, and each development that came true shifted the odds of the others. In 1968 Gordon and Hayward programmed the approach at UCLA and published “Initial Experiments with the Cross Impact Matrix Method of Forecasting” in Futures. Their central idea was that the occurrence of one event changes the probability of others, and that those changes can be written down, cell by cell.
The method has branched several ways since:
- Probabilistic cross-impact. The original line. Experts estimate a starting probability for each event and how each event would raise or lower the others, then a computer plays the matrix out many times. Gordon later wrote the standard description of the method for the Millennium Project’s Futures Research Methodology.
- Structural analysis. A French school associated with Michel Godet uses a cross-impact grid of influences, not probabilities, to rank which variables drive a system and which only respond.
- Cross-impact balances. Wolfgang Weimer-Jehle of the University of Stuttgart set out a qualitative version in Technological Forecasting and Social Change in 2006. It uses the grid to test which combinations of outcomes are internally consistent, which makes it a scenario-checking tool.
- The intelligence version. Heuer and Pherson’s Structured Analytic Techniques for Intelligence Analysis, a widely used textbook for intelligence analysts, includes the Cross-Impact Matrix as a core technique for working out how the variables in a problem act on each other.
The consistency use is worth a moment. In 2012, Vanessa Schweizer and Elmar Kriegler ran cross-impact balances on the same information the authors of the IPCC’s emissions scenarios had used around 2000. They found that coal-powered growth was a clearly discernible possible future at the time and was under-represented in the published scenarios, and that some of the published scenarios were not internally consistent. A grid filled in carefully can catch what a talented writing team missed.
How to do a cross-impact analysis, step by step
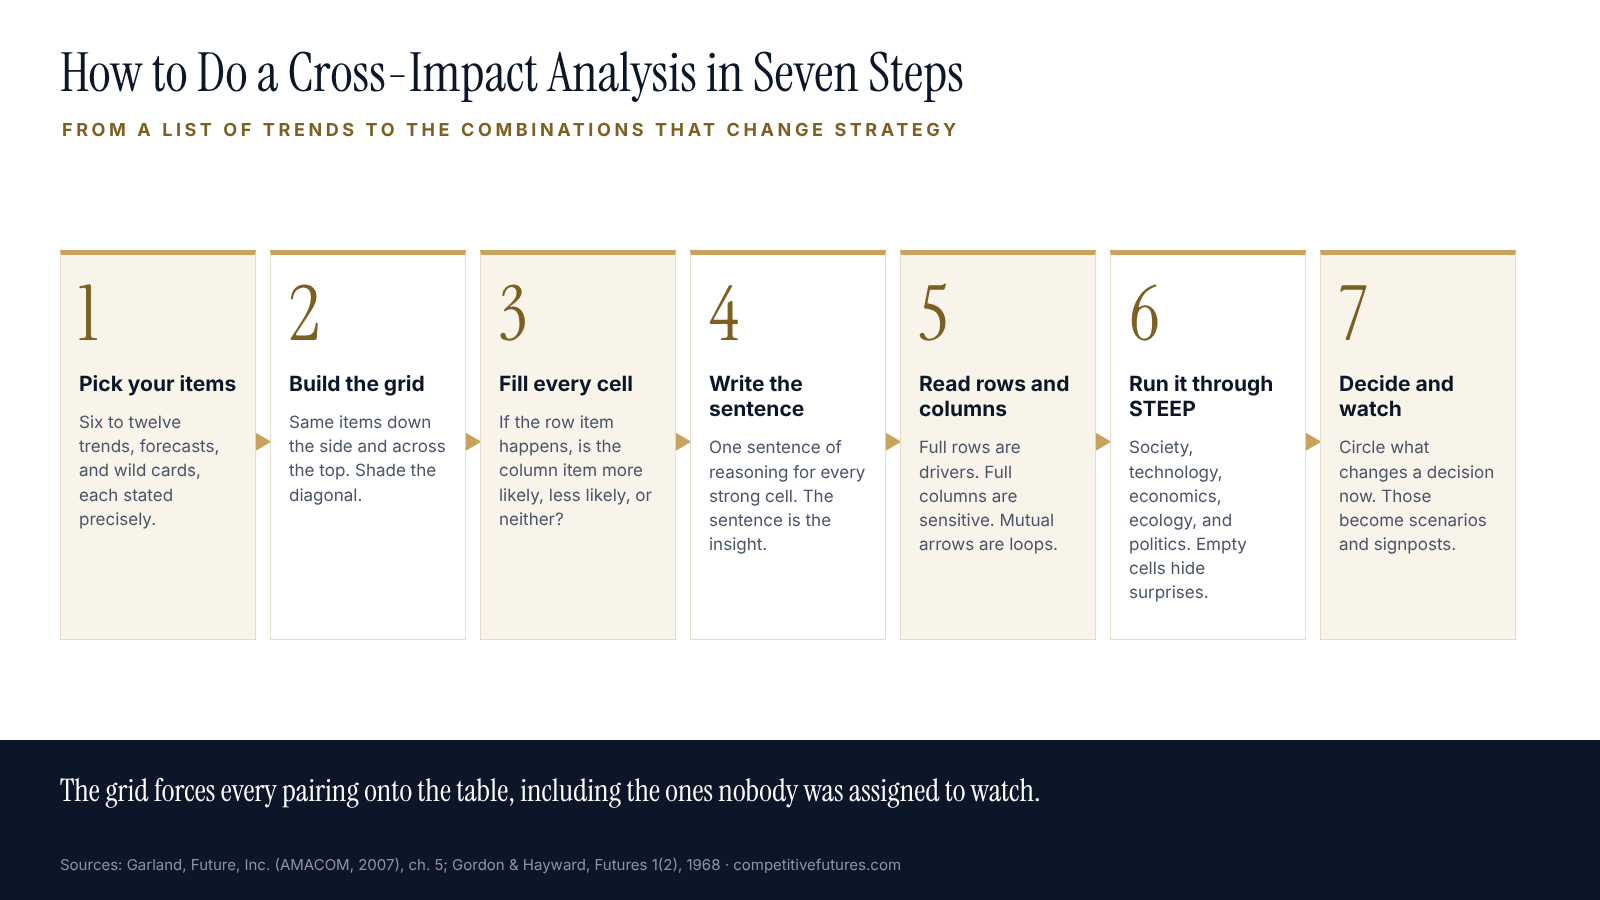
- Pick your items. Start with the trends, forecasts, and wild cards your research turned up. Keep the list short enough to finish: six to twelve items for a first pass. State each one precisely. “AI” is too vague; “most routine diagnostic imaging is read first by software by 2030” is something you can reason from.
- Build the grid. List the items down the left side and in the same order across the top. Shade out the diagonal; an item does not act on itself.
- Fill every cell, row by row. For each cell ask one question: if the row item happens, does it make the column item more likely, less likely, or neither? Mark it with an up arrow, a down arrow, or a dot. If you want more resolution, use a scale from −3 to +3. Read the grid in one direction only. A acting on B is a different question from B acting on A.
- Write one sentence for every strong cell. The arrow is a placeholder. The sentence is the insight. “The clinician shortage pushes hospitals to adopt AI reading tools faster than they would otherwise” is something a planning committee can argue with.
- Read the rows and columns. A row full of arrows is a driver: it moves many other things. A column full of arrows is sensitive: many things move it. Two items that strengthen each other form a loop, and loops are where change accelerates beyond anyone’s linear forecast.
- Run it through STEEP. In Future, Inc. I recommend going back to society, technology, economics, ecology, and politics to filter what you find. Most grids are full of technology and economics. If the social and political cells are empty, that is where the next surprise will come from.
- Turn the results into decisions and signposts. Circle the interactions that would change a decision you are making now. Those become the spine of your scenarios and the indicators you watch.
A worked example: a hospital system looking to 2035
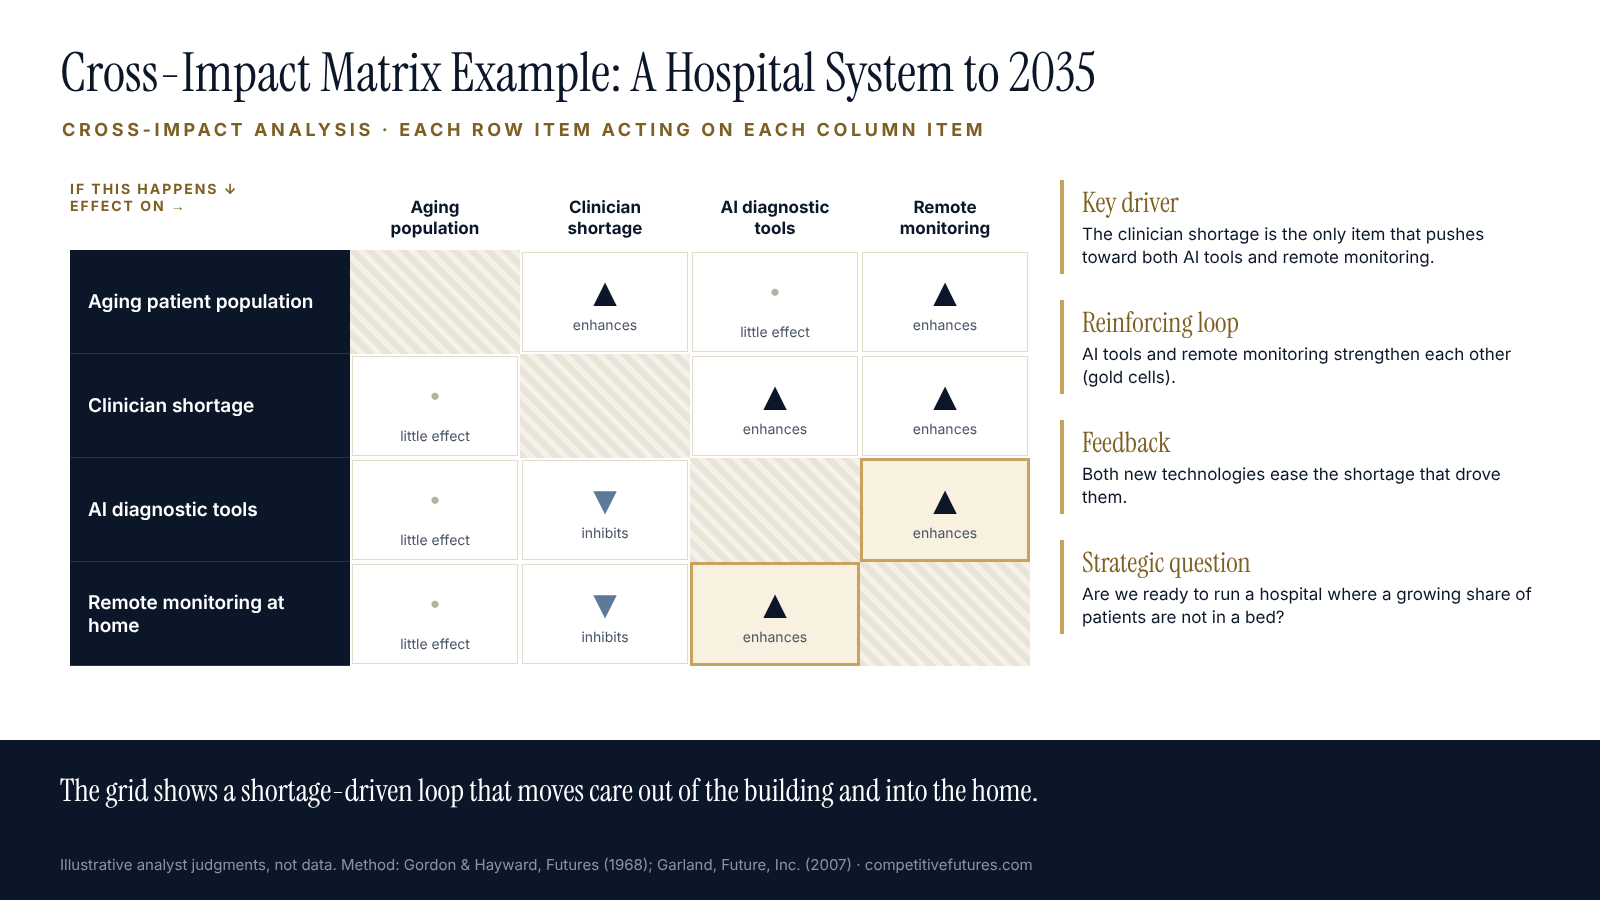
Here is a small grid of the kind a regional hospital system might draw. The four items are trends the system’s planners would already be tracking: an aging patient population, a shortage of clinicians, AI diagnostic tools, and remote patient monitoring at home. The arrows are illustrative analyst judgments, not data.
Read across the rows and three things stand out. The aging population adds demand on staff and on home care. But the clinician shortage is the key driver: it is the only item that pushes the system toward both AI tools and remote monitoring, because each stretches a scarce nurse or physician across more patients. AI tools and remote monitoring strengthen each other: monitoring produces a stream of data that only software can read at scale, and software makes the monitoring worth doing. And both of them push back on the shortage that drove them.
None of those findings is visible on a trend list. Looked at one at a time, a planner sees four separate projects in four separate budgets. The grid shows one system: a shortage-driven loop that moves care out of the building and into the home. The strategic question is no longer “should we buy an AI tool?” It is “are we ready to run a hospital where a growing share of the patients are not in a bed?”
Common mistakes
- Making the grid too big. Twenty items means 380 cells. Teams get tired, start marking everything a dot, and the grid stops telling the truth. Split a big study into clusters and cross them in stages.
- Filling it alone. In the book I called implications “a team sport.” A grid filled by one analyst records one analyst’s assumptions. Five to ten people with different backgrounds will argue over the cells, and the arguments are worth more than the arrows.
- Confusing correlation with cause. A cell says that one item makes another more or less likely. It does not prove the mechanism. Write the sentence for each strong cell so the reasoning can be checked.
- Writing platitudes. “Competition will intensify” is not a cross-impact. Neither is “everything will be more efficient.” Ask why, and by how much.
- Stopping at the grid. The matrix is a means. If it does not change a scenario, a decision, or a watch list, the afternoon was wasted.
What cross-impact analysis teaches about building an intelligence function
Most organizations collect intelligence in silos. The regulatory team watches regulators, the technology team watches vendors, and the sales team watches customers. Each produces a sound report, and nobody is paid to read the reports against each other. Cross-impact analysis is that job written down as a procedure.
An intelligence function that uses it gains three things. It finds the interactions between departments’ findings before a competitor does. It gets a record of its own assumptions, cell by cell, which can be reviewed when events prove some of them wrong. And it gets a short list of driver variables to watch, which is what senior leaders actually want from foresight work: not forty trends, but the four that move the rest.
Frequently asked questions
What is cross-impact analysis?
A futures research method that lists trends, events, or forecasts in a grid and assesses, pair by pair, whether each one makes the others more likely, less likely, or leaves them unchanged. The result shows which items drive the system and which combinations deserve strategic attention.
Who invented cross-impact analysis?
Theodore J. Gordon and Olaf Helmer, both formerly of the RAND Corporation, developed it in the mid-1960s while designing the forecasting game *Future* for Kaiser Aluminum. Gordon and Howard Hayward published the first computer-based version in *Futures* in 1968.
What is a cross-impact matrix?
The grid at the heart of the method. The same items run down the rows and across the columns, and each cell records the effect of the row item on the column item, as an arrow, a sign, a score, or a conditional probability.
How is cross-impact analysis different from the Futures Wheel?
The Futures Wheel starts from one change and traces its consequences outward ring by ring. Cross-impact analysis starts from many changes and examines how they act on each other. Many projects use both: the wheel for the most important single driver, the matrix for the full set.
How many items should a cross-impact matrix have?
Six to twelve for a first pass. The number of cells grows with the square of the list, so a 12-item grid already has 132 judgments to make. Larger studies can be split into clusters.
Do I need software for cross-impact analysis?
No. A whiteboard or a large sheet of poster paper works for a qualitative grid. Software becomes useful for probabilistic versions that simulate thousands of runs, or for consistency methods such as cross-impact balances with many variables.
Work with Competitive Futures
Competitive Futures runs foresight projects and executive workshops in which teams build cross-impact grids on their own markets, with their own trends. If your organization tracks many trends and wants to know which combinations matter, contact the company.
Related reading
- The Futures Wheel: How to Map the Second- and Third-Order Effects of Change
- Scenario Planning
- Systems Mapping
- How to Evaluate a Forecast
- The Impact-Probability Matrix for Scenario Planning
- STEEP Analysis
- Second-Order Effects
References
- Garland, Eric. Future, Inc.: How Businesses Can Anticipate and Profit from What’s Next. New York: AMACOM, 2007. Chapter 5, “Strategic Implications.”
- Gordon, T. J., and H. Hayward. “Initial Experiments with the Cross Impact Matrix Method of Forecasting.” Futures 1, no. 2 (1968): 100–116. https://doi.org/10.1016/S0016-3287(68)80003-5
- Gordon, Theodore J. “Cross-Impact Analysis.” In Futures Research Methodology, Version 3.0, edited by Jerome C. Glenn and Theodore J. Gordon. Washington, DC: The Millennium Project, 2009. https://www.millennium-project.org/futures-research-methodology-version-3-0/
- Dayé, Christian. Experts, Social Scientists, and Techniques of Prognosis in Cold War America. Cham: Palgrave Macmillan, 2020. https://doi.org/10.1007/978-3-030-32781-1
- Weimer-Jehle, Wolfgang. “Cross-Impact Balances: A System-Theoretical Approach to Cross-Impact Analysis.” Technological Forecasting and Social Change 73, no. 4 (2006): 334–361.
- Schweizer, Vanessa J., and Elmar Kriegler. “Improving Environmental Change Research with Systematic Techniques for Qualitative Scenarios.” Environmental Research Letters 7 (2012): 044011.
- Heuer, Richards J., Jr., and Randolph H. Pherson. Structured Analytic Techniques for Intelligence Analysis. 3rd ed. Thousand Oaks, CA: CQ Press, 2020.
Part of the Strategic Foresight guide from Competitive Futures.