Systems Mapping for Strategy: How to Draw the Ecosystem Around a Decision
Ask an executive about the future of their industry and you will usually get an answer about their product. Ask what could change that future and you will get an answer about their competitors. Both answers leave out most of what actually decides the outcome: suppliers, regulators, customers’ habits, new technologies, the economy, the environment, and the people outside the industry who do not yet know they are about to enter it. A systems map is how you put all of that on one page before you start researching, so you know where to look.
What a systems map is
A systems map is a diagram of everything that touches the thing you are trying to understand: where its inputs come from, who handles it, who uses it, what it competes with, and what outside forces push on each part. It is the first step in any serious foresight or competitive intelligence project, because it decides which trends you will research and which you will ignore.
In Future, Inc. (AMACOM, 2007), I described the logic this way: “The future of anything is like an ecosystem. It is made up of a variety of systems and activities.” The book’s argument is that business is better understood through biology than through war. In an ecosystem, organisms compete, cooperate and depend on one another all at once, and a change in one part ripples through the rest. As I wrote, “Nothing exists in and of itself, but rather as a web of connections. As the nature of the web changes, so does each part.”
Systems thinking has a long pedigree outside futures work. It began in engineering and management science, most famously with Jay Forrester’s system dynamics work at MIT, and its best short introduction is still Donella Meadows’s essay “Leverage Points: Places to Intervene in a System” (1999). You do not need any of that mathematics to draw a useful map. You need a big sheet of paper and the discipline to keep asking “what else touches this?”
A real project: the future of water

In 2002, one of the largest infrastructure engineering firms in the world asked us a question that sounded simple: what is the future of water? The firm built municipal water systems. Its executives were rattled because, for the first time in their careers, Americans were paying a premium for branded bottled water, much of it filtered municipal water, bottled and chilled. To engineers who prided themselves on delivering safe, nearly free water to every tap, the trend looked absurd.
Instead of starting with the water business, we started with the water. As I described it in the book, I asked, “What does water do all day?” Where does it come from? What purpose does it serve? Who works with it? What can go wrong?
Then we drew the answers as a cycle: the ecosystem, the waterworks, treatment, the tap, the drain, the sewer, and back. Bottling appeared as a side branch, competing with milk, juices, soft drinks, beer and wine.
Around the cycle we wrote the players (homes, offices, restaurants, farms, factories, travelers) and the reasons they use water (thirst, safety, convenience, cooking, cleaning). Then we added the forces that could change every part of it: climate, demographics, health trends, filter technologies, biotechnology and nanotechnology.
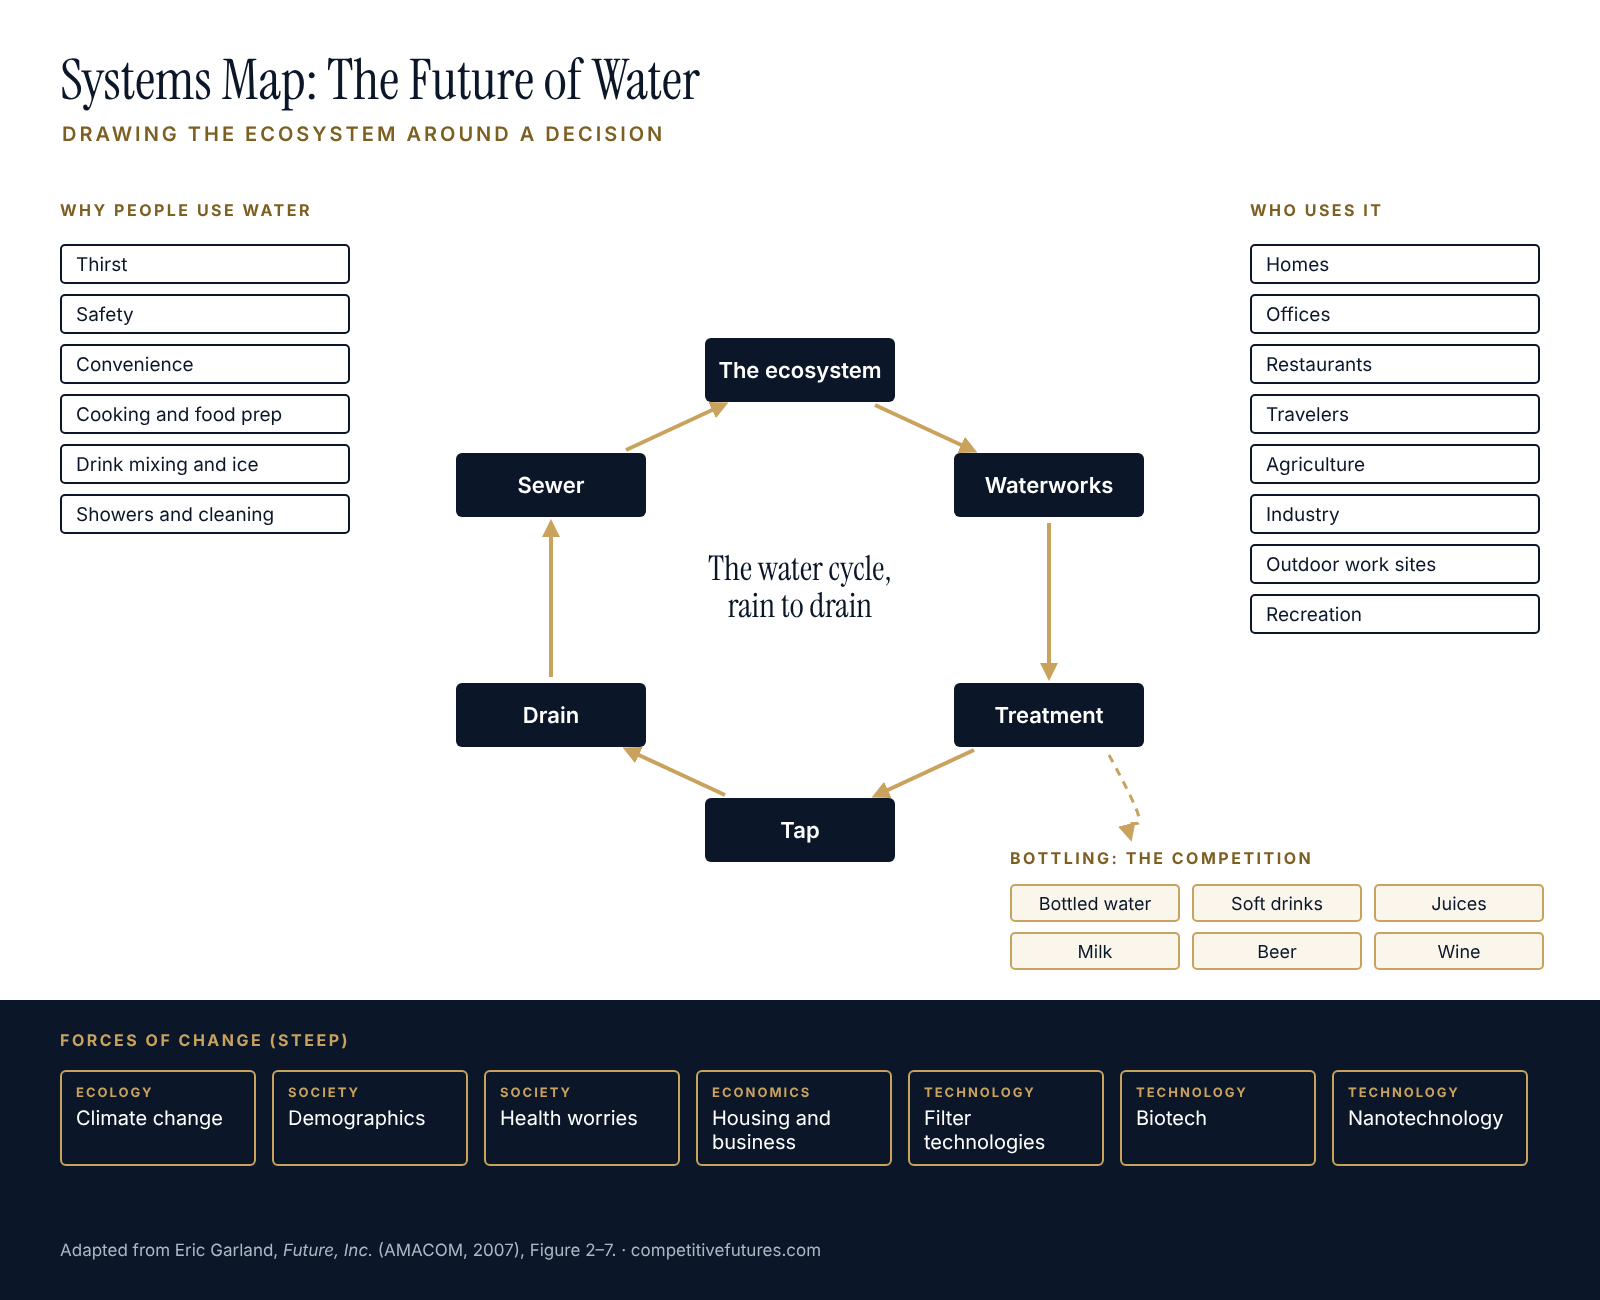
Read that map today and the answer to the executives’ worry is sitting on it. Bottled water appears on the branch next to soft drinks, milk and juice, not next to the tap, and health trends push on all of them from the edge of the page. The engineers framed bottled water as a question about trust in their product. The map framed it as a fight over what people drink instead of sugar. Fourteen years later, Americans drank more bottled water than carbonated soft drinks for the first time: 39.3 gallons per person in 2016, against 38.5 for soda, according to Beverage Marketing Corporation (CNBC).
How to do systems mapping, step by step
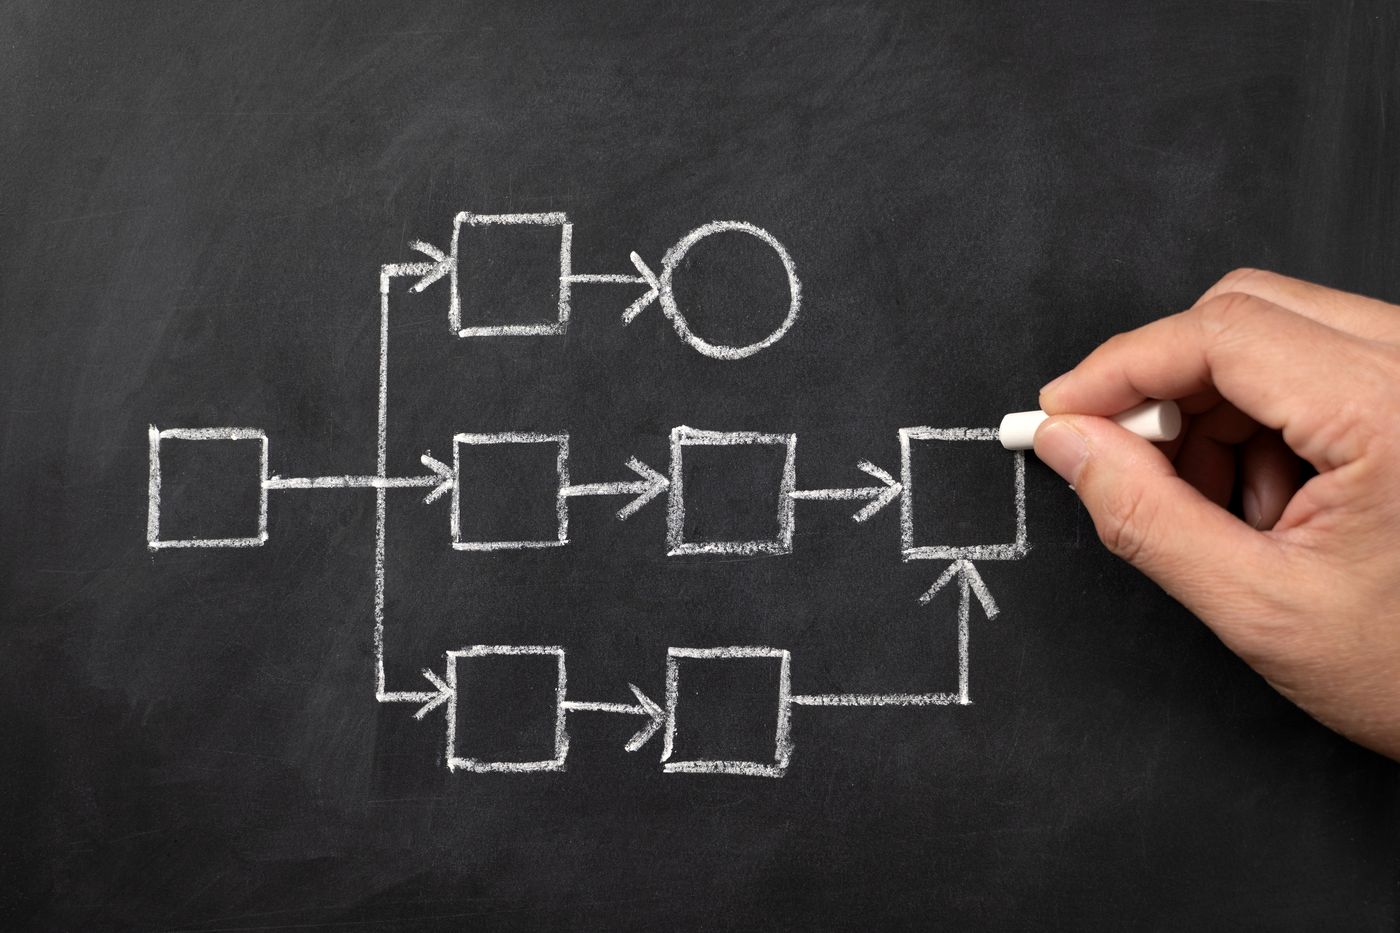
- Tell the story and diagram it. Start with a plain question: where does this come from, and where does it go? Draw the flow as boxes and arrows, from raw material to end user and back to disposal or recycling. For beer, the book’s running example, that meant agriculture, brewing, packaging, shipping, distribution and retail, consumers, and waste.
- Identify the players. Add everyone who touches each stage: employees, customers, suppliers, regulators, competitors, critics. For each, ask what they are doing, how they are changing and what would make them change further.
- Add the forces. Around the edges, write the trends that could alter any part of the flow. Use the STEEP checklist so you do not stop at technology: society, technology, economics, ecology and politics.
- Include the competition you do not see. Put substitutes on the map, not just rivals. The water engineers’ real competitor was a soft-drink bottler, not another engineering firm.
- Use the map to choose your research. Every box and arrow is a place where change could start. Rank them by how much a change there would hurt or help you, and research the top of the list first.
- Put it on the wall. The book’s advice still holds: hang the map where your team will see it every day. A map that lives in a slide deck is forgotten in a week.
STEEP: the checklist that keeps the map honest

STEEP stands for society, technology, economics, ecology and politics. Its job is to drag you outside your own expertise. In the book, I ran it on the most boring product I could think of, a chocolate bar, and found a candy industry surrounded by moving parts: childhood obesity and diabetes in the society column, smart packaging in technology, currency swings and sugar prices in economics, rain-forest destruction in ecology, and, in politics, the possibility that lawyers who had beaten Big Tobacco might go after “Big Chocolate.” If a chocolate bar has that many vectors of change, your industry has more.
Using systems mapping for competitive intelligence
A systems map is also the best defense against the most common competitive intelligence failure, which is watching only the competitors you already know. When you map the whole flow, you see where a new entrant could slip in: a cheaper input, a new distribution channel, a regulation that lowers the barrier to entry. Meadows’s essay makes a related point about where change comes from. She ranks places to intervene in a system, from the weakest (adjusting numbers like taxes and subsidies) to the strongest (changing a system’s rules, its goals and the mindset behind it), and warns that the strong ones are “not intuitive.” A rival who changes the rules of your market will beat one who merely cuts prices.
The same lesson is in my satirical second book, How to Predict the Future…and WIN! (2011), under the tip “Never suggest the whole model may be changing.” The serious section underneath it warns that “in a world of transformation you will likely need to change something pretty major,” and defines the stakes: “A new business model occurs when your position in the value chain changes radically and you ask for money in new ways, for different reasons, from different customers.” A systems map is how you see that coming. The book’s cautionary example is the record industry, which watched the MP3 change its position in the value chain and responded mostly by suing its customers.
Common mistakes
- Mapping the org chart instead of the system. Your departments are not the system. The flow of materials, money, information and people is.
- Stopping at the industry boundary. The forces that matter most usually start outside it.
- Making it too detailed too soon. The water map grew complex because the client wanted detail. A first map should fit on one page and take an afternoon.
- Treating it as finished. A systems map is a starting point for research, not a conclusion. Redraw it as you learn.
Frequently asked questions
What is the difference between a systems map and a value chain?
A value chain shows how one company adds value from inputs to sale. A systems map shows the whole ecosystem around a decision, including substitutes, regulators, social trends and forces outside any company’s control.
What is STEEP analysis?
STEEP is a checklist for scanning the environment: society, technology, economics, ecology and politics. Variants such as PEST and PESTLE add or rename categories, but the purpose is the same: to make sure you look beyond your own field.
How long does it take to build a systems map?
A first draft takes a few hours with a small team. In a full foresight project, the map is refined as trend research comes in.
Related reading
- Strategic Foresight: A Practitioner’s Guide to Seeing What’s Coming
- Michael Porter’s Five Forces of Competition
- How to use trend analysis for business strategy
Competitive Futures builds systems maps and runs foresight studies for companies and governments; details are on the services page.