How to Read a Trend Curve
Read this page in: Français · Español · Português · Deutsch · Nederlands · Italiano · 日本語 · 한국어 · Bahasa Indonesia · Polski · Čeština · Svenska · Dansk · Norsk (bokmål) · Suomi · Ελληνικά · Türkçe · Eesti
A trend curve is a picture of how something has changed over time, and reading one well comes down to four questions: is the chart honest, what shape is the line, where on that shape are we now, and what would make it break? Most people answer only the second question, and only in a hurry. They see a line going up, extend it with a ruler, and call it a forecast. That habit is the source of most bad strategy decks.
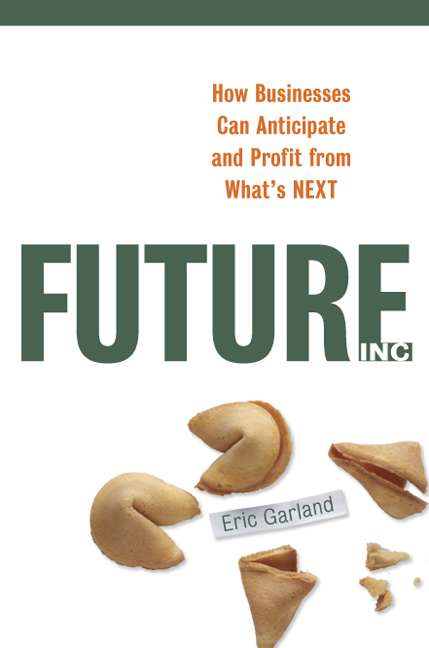
In Future, Inc. (AMACOM, 2007) I put the warning this way: “Remember trends aren’t forecasts. They are just graphical representations of the data thus far collected.” A curve tells you where you have been. Reading it well tells you which questions to ask about where you are going.
At a glance
- Check the chart first. Before you read the shape, read the axes, the start and end dates, the units, and the source. A log scale, a cut-off axis, or a well-chosen start year can make any trend look dramatic.
- Name the shape. Steady line, S-curve, exponential climb, or collapse. Each shape points to a different question. Our trend analysis guide covers the four basic shapes.
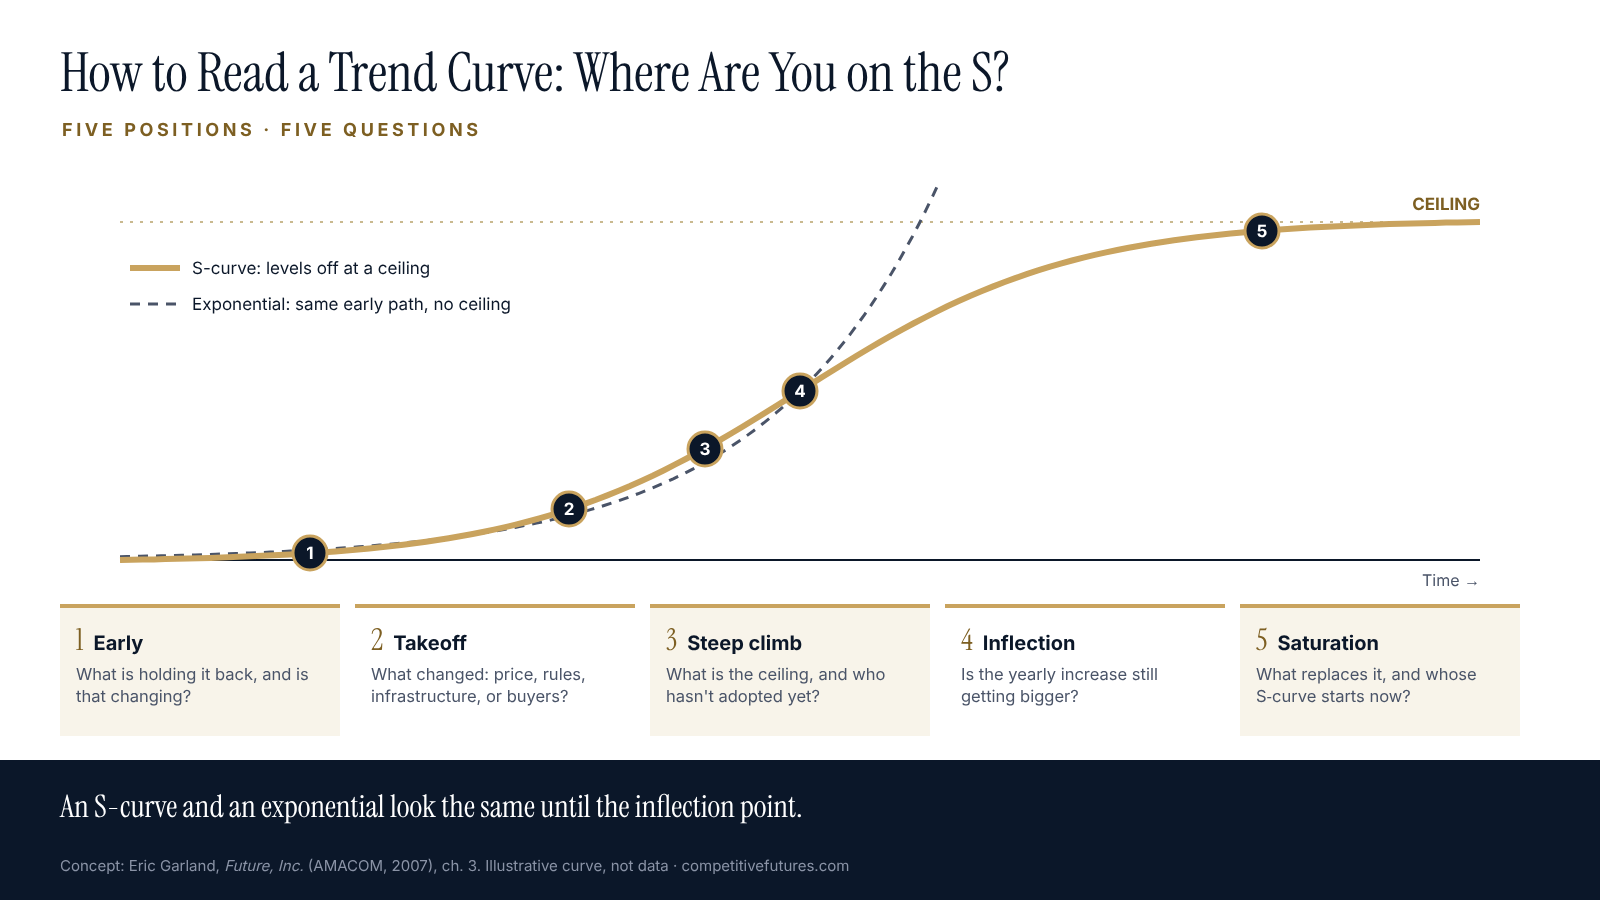
- Find your position. An S-curve and an exponential curve look the same until the inflection point. The way to tell them apart is to estimate the ceiling from outside the data.
- Watch the rate, not just the level. When the growth rate starts falling while the total keeps rising, you have probably passed the inflection point.
- Ask when it breaks. Every trend ends or bends. The useful question is what would cause that, and whether it is already happening.
Check the chart before you read the shape
A trend curve is an argument. Somebody chose the data, the time window, and the scale. Before you decide what the line means, check five things.
The source. Who collected the data, and why? Official statistics, regulators’ reports, and peer-reviewed studies come first. A chart in a vendor’s slide deck is a marketing claim until you find the series behind it. Our trend analysis guide sets out the ladder of sources.
The scale. On a linear axis, steady percentage growth curves upward. On a logarithmic axis, the same growth is a straight line. Neither is wrong, but you need to know which you are looking at. A curve that “flattens” on a log scale may still be growing fast in absolute numbers.
The axis. A vertical axis that starts at 95 instead of zero turns a 3 percent change into a cliff. Check where the axis starts before you react to the slope.
The window. Start and end dates are choices. Begin a chart at a peak and almost anything looks like a decline; begin it at a trough and almost anything looks like a boom. In the book I wrote that I usually look “10 to 100 years in the past and 5 to 20 years into the future.” A five-year chart rarely shows you the shape.
The units. Totals or per person? Dollars of the day or dollars adjusted for inflation? Levels or rates? These choices can reverse the story. In 2024 the number of births in the United States rose 1 percent, to 3,628,934. In the same year the general fertility rate, which adjusts for the number of women of childbearing age, fell 1 percent (NCHS, final 2024 birth data). Both are true. A headline that reports only one of them tells you the opposite of what the other does.
Name the shape, then ask its question
Chapter 3 of Future, Inc. sorts trends into four families: linear trends (up, down, or flat), S-curves, exponential growth, and exponential decline. The point of naming the shape is that each one asks a different question.
- Linear. Something changes at a steady rate. The book’s question: “When might a trend change?” Nothing climbs or falls at a constant rate forever.
- S-curve. Fast growth that levels off at a natural limit. Is there a ceiling, and how close are we to it?
- Exponential growth. Growth that starts slowly and then explodes. The book’s question: “ask yourself how far up the curve we are.”
- Exponential decline. A disruption that ends an older way of doing things, as cheap refrigerators ended home ice delivery. Who is on the wrong side of this curve, and is it us?
Most real trends are combinations. A market can grow in a straight line for a decade, take off, flatten, and then collapse when something new replaces it. The shape you see depends on which stretch of the story the chart shows.
Where are you on the curve?
This is the hardest part of reading a trend, and the part most people skip.
Almost everything that spreads through a society, whether a product, a practice, or a law, follows an S: slow for a long time, then suddenly fast, then flat. The trap is that the first half of an S-curve looks exactly like an exponential curve. Before the inflection point, both lines bend upward at a quickening pace, and the data alone can fit either one. Executives who catch a trend in its steep stretch assume the climb goes on forever. Executives who catch it in the slow stretch dismiss it, because it has been “five years away” for fifteen years.
Two habits get you out of the trap.
Estimate the ceiling from outside the data. The curve itself won’t tell you where it stops. The world will. The book’s example was home computers: a drop in price opens the market to millions more buyers, “but eventually you run out of homes without PCs.” Count the potential adopters, the money, the land, or the hours in the day, and you have a rough ceiling. If the curve is already at 70 percent of it, it is an S, whatever it looks like on the slide.
Watch the growth rate, not just the total. On an S-curve, the yearly increase gets bigger until the inflection point and then starts shrinking, even while the total keeps rising. Plot the year-over-year change beside the level. When the total is still climbing but the increase is smaller than last year’s, you are probably past the steepest part.
Each position on the S has its own question:
- Early. Little visible change. What is holding it back, and is that changing?
- Takeoff. The line starts to bend. What changed: price, regulation, infrastructure, or a new kind of buyer?
- Steep climb. It looks unstoppable. What is the ceiling, and who hasn’t adopted yet, and why?
- Inflection. Growth is at its fastest and about to slow. Is the yearly increase still getting bigger?
- Saturation. The curve flattens. What replaces it, and whose S-curve is starting now?
When curves break: three trends from 2007, read again
The best way to learn how curves behave is to take a set of readings and come back years later. In chapter 3 of Future, Inc., written in 2006, I used three examples of linear trends and one exponential one. Here is what three of them look like in the latest official data.
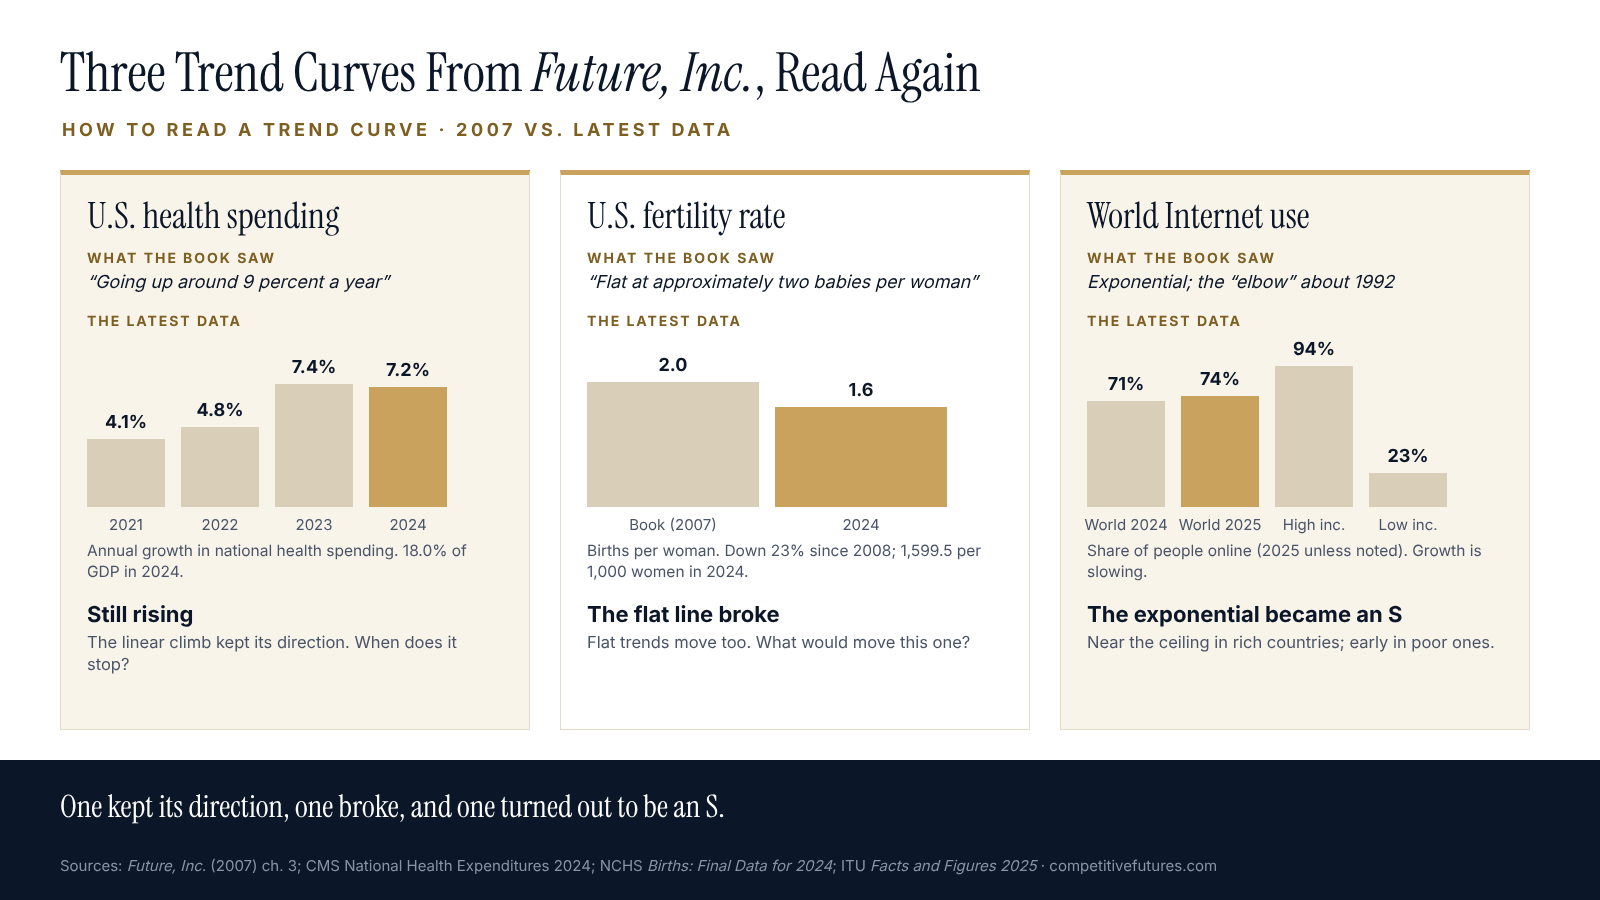
U.S. health care costs: the rising line kept rising. The book described health care costs “going up around 9 percent a year” and asked what would make them stop. They haven’t stopped. National health spending grew 7.2 percent in 2024 to $5.3 trillion, or $15,474 per person, and reached 18.0 percent of the economy (CMS, National Health Expenditures 2024). The rate has moved around. Growth was 4.1 percent in 2021 and 4.8 percent in 2022, then 7.4 percent in 2023 (CMS, NHE 2024 highlights). The line wobbles, but its direction hasn’t changed, and the book’s question is still open.
The U.S. birth rate: the flat line broke. The book showed America’s birth rate as the horizontal line, “flat at approximately two babies per woman.” Flat lines are the easiest ones to ignore, and this one moved. The total fertility rate has generally declined since 2008, down 23 percent, and stood at 1,599.5 births per 1,000 women in 2024, or about 1.6 per woman (NCHS, Births: Final Data for 2024). A flat trend is still a trend, and the question for a flat line is the same as for any other: what would make it move?
Internet use: the exponential bent into an S. The book’s example of exponential growth was the number of Internet users, with the “elbow” of the curve around 1992. It asked, “When will this exponential growth slow down?” The answer is now visible. The International Telecommunication Union estimates that 74 percent of the world’s population, about 6 billion people, were online in 2025, up from 71 percent a year earlier (ITU, Facts and Figures 2025). The ITU’s own summary says progress continues but is slowing. In high-income countries, 94 percent of people use the Internet, which is close to a ceiling. In low-income countries the figure is 23 percent. The global curve is flattening at the top, while the curve for the poorest countries is still in its early stretch.
None of these outcomes could be read from the shape of the line alone. They came from asking each curve its question and checking the data again years later.
Common ways to misread a trend curve
- Extending the last three points. Short runs of data are mostly noise. Read the longest series you can find before you draw a line forward.
- Treating a flat line as no news. The birth-rate example above was flat for decades before it wasn’t.
- Confusing the level with the rate. “Spending is at a record” and “spending growth is slowing” can both be true in the same year.
- Mistaking the steep part of an S for an exponential. If you can’t name a ceiling, you haven’t finished reading the curve.
- Mistaking a news cycle for a trend. A burst of coverage is not data. Find the underlying series before you believe the slope.
- Forgetting that someone drew the chart. Every chart has an author, a window, and a scale. Check all three.
What this means for an intelligence function
Reading trend curves is a core skill for any team that briefs leaders on what is coming. A few practices make it routine instead of a one-off.
- Keep the series, not just the slide. Store the underlying data for every trend you brief, with its source and the date you pulled it, so you can update it instead of redrawing it from memory.
- Brief the question with the curve. Every trend chart that goes to leadership should come with the question its shape raises: when does it stop, how close is the ceiling, or what would make it move?
- Track the rate beside the level. A second line showing the year-over-year change catches inflection points months or years before the total looks different.
- Revisit old readings on a schedule. Once a year, pull the trend charts you briefed three or five years ago and check them against the new data. It is the cheapest way to calibrate a team’s judgment.
- Separate the trend from the forecast. A trend is the data so far. A forecast is a claim about what comes next, made by someone, on some basis. Our guide to evaluating a forecast covers the second step.
Frequently asked questions
What is a trend curve?
A trend curve is a chart of how a measurable thing has changed over time, such as prices, users, births, or sales. It shows the direction and shape of change so far. It is not a forecast, though it is the raw material for one.
What are the main types of trend curves?
The four basic shapes are linear (steady change up, down, or flat), the S-curve (fast growth that levels off), exponential growth (slow, then explosive), and exponential decline (a fast collapse, often after a disruption). Real trends often combine them over time.
How can you tell an S-curve from exponential growth?
Not from the early data alone, because both bend upward the same way before the inflection point. Estimate the ceiling from outside the data, such as the number of possible buyers, and watch the year-over-year growth rate. When the yearly increase starts shrinking while the total still rises, you are looking at an S-curve past its inflection point.
Is a trend the same as a forecast?
No. A trend describes what has happened. A forecast is a claim about what will happen, usually with a date attached. Extending a trend line is one way to make a forecast, and often a poor one, because it assumes the shape won’t change.
How much history do you need to read a trend?
As much as you can get. For strategic questions, ten years is a minimum and several decades is better. Short windows exaggerate noise and hide the shape, and the choice of start date can change the story.
What is the most common mistake in reading trend charts?
Extending the most recent stretch of the line as if it will continue unchanged. Close behind it: ignoring the axis scale, confusing totals with rates, and treating a flat line as a sign that nothing will change.
Work with Competitive Futures
Competitive Futures helps companies and governments find the trends that matter to them, read them correctly, and turn them into decisions. If your organization needs a clearer view of the forces shaping its next five to twenty years, talk to us about a strategic foresight engagement or a keynote.
Related reading
- Trend Analysis: How to Tell a Real Trend From Media Hype
- STEEP Analysis: How to Scan the Forces Shaping Your Future
- How to Evaluate a Forecast: A Field Guide for Intelligence and Strategy Teams
- Second-Order Effects: So What? What If? What Else?
- Scenario Planning: How to Build Scenarios That Change Decisions
- 25 Foresight Mistakes: How Organizations Ruin Their View of the Future
References
- Garland, E. (2007). Future, Inc.: How Businesses Can Anticipate and Profit from What’s Next. AMACOM. Chapter 3, “Analyzing Trends: Real Change vs. Media Hype.”
- Centers for Medicare & Medicaid Services. NHE Fact Sheet: Historical NHE, 2024 and National Health Expenditures 2024 Highlights.
- Osterman, M. J. K., Hamilton, B. E., Martin, J. A., Driscoll, A. K., & Valenzuela, C. P. Births: Final Data for 2024. National Vital Statistics Reports, vol. 75, no. 2. National Center for Health Statistics, 9 June 2026.
- International Telecommunication Union. Measuring Digital Development: Facts and Figures 2025. Geneva, 2025.
This page is part of our guide to Strategic Foresight.