Trend Analysis: How to Tell a Real Trend From Media Hype

In the summer of 2001, American television was consumed by sharks. Every attack led the news, experts debated shark behavior on cable, and swimmers were warned to stay out of the water. The press called it the Summer of the Shark. There was one problem. According to the International Shark Attack File at the Florida Museum of Natural History, there were 76 unprovoked shark attacks worldwide in 2001, down from 85 the year before, and fatalities fell from 12 to 5 (University of Florida). The trend everyone was talking about was not a trend at all.
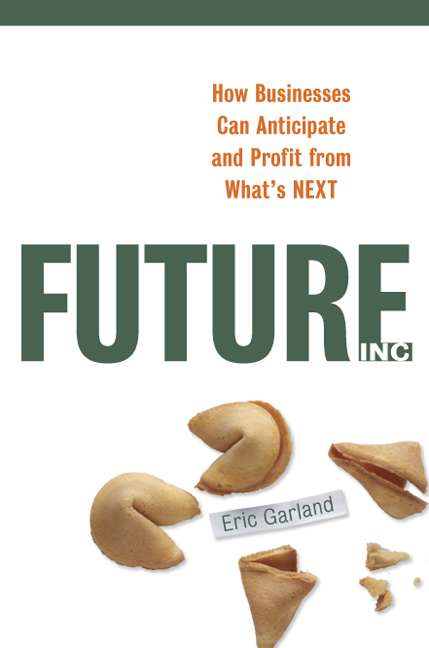
I opened the trend chapter of Future, Inc. (AMACOM, 2007) with that story because it captures the central problem of trend analysis. Most of our assumptions about what is changing come from casual impressions, and the casual impressions come from the media. Trend analysis is the discipline of replacing those impressions with data.
What counts as a trend
The definition is broad. As I wrote in the book, “The official definition of a trend is quite broad: any change that happens over time.” The sun slowly burning out is a trend, just not one your board needs to hear about. What makes a trend useful is that it is real (measured, not merely reported), relevant to your system, and moving fast enough to matter within your planning horizon.
Two distinctions keep you out of trouble. A trend is not a fad: a fad spikes and vanishes, while a trend shows sustained change in data collected over years. And a trend is not a forecast. In the book’s words, “Remember trends aren’t forecasts.” A trend tells you where things have been heading. Whether they keep heading there is a separate question, one for expert forecasts and for your own judgment.
Three steps to trend analysis
- Start from your systems map. A systems map tells you which parts of the world touch your business, so you know where to look for change and do not drown in everything else.
- Ask questions before you read reports. For each part of the map, ask what is changing. Who buys this now, and is that shifting? Are producers making it differently? What new technology could touch it? Your questions direct the research; a 200-page report read without them just buries you.
- Find the best sources, and climb the ladder of reliability. Start broad and work toward the most rigorous evidence you can find.
The ladder of sources
Trade and popular media are where you warm up. Trade magazines tell you what an industry is worried about. Read the editorials, the ads and the annual “future trends” issue. But as I warned in the book, “Two mentions in Newsweek do not a trend make.” Popular media gives you leads, not evidence.
Official reports from government agencies, universities, international organizations and nonprofits are often excellent and free. Statistical agencies such as the U.S. Census Bureau are among the best sources on earth for demographic and economic trends. Read them for the data, not the press release.
Peer-reviewed research is the most reliable source in any technical field, because experts police it. Its weakness is narrowness: you will get precise details about a slice of a field, not a view of where the whole thing is going.
Advocacy sources need extra care. In a project on sustainable agriculture, I assumed topsoil erosion and farm runoff were worse than ever, because that is what the activist reports I read implied. Their statistics were alarming but poorly sourced, and none of them said whether the problem was getting better or worse. The Department of Agriculture’s data told a different story: the problem still needed work, but conservation programs were steadily reducing it. The activists were not lying. They had left out the direction of the trend, which is the only part a futurist needs. Verify any alarming figure with a second, independent source before you build on it.
The first worst practice in my satirical second book, How to Predict the Future…and WIN! (2011), is “Listen to major media exclusively.” Every source higher on the ladder is a cure for it.
What shape is the trend?
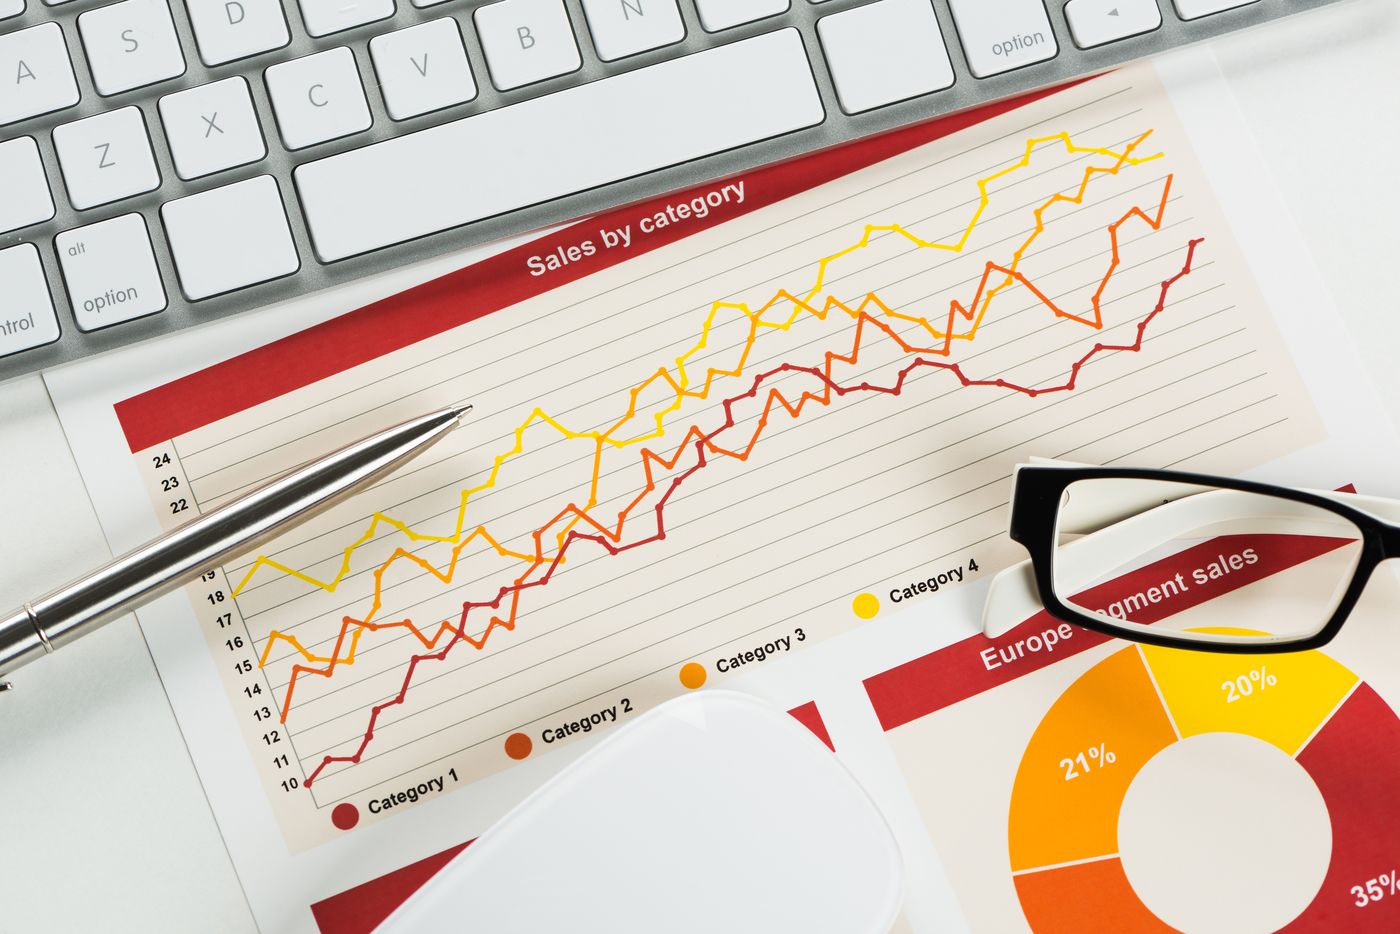
Once you have the data, ask what kind of curve you are on, because the shape tells you what question to ask next.
- Linear: steady change up, down or flat. The question is what would make it stop.
- S-curve: rapid growth that eventually hits a natural limit, the way home computer sales flattened once most homes had one. The question is how close the ceiling is.
- Exponential: slow, then explosive. Internet use sat at the elbow of that curve around 1992. The question is how far up the curve you are.
- Exponential decline: a disruption wipes out an old activity, the way cheap refrigerators wiped out ice delivery. The question is whether your business is the iceman.
A worked example, graded
The running case study in Future, Inc. was the future of beer, and twenty years later it shows both the power and the limits of trend analysis.
The strongest trend I found was young drinkers moving away from beer. Gallup’s data bear it out: in the early 1990s, 71 percent of drinkers under 30 said beer was what they drank most often, and by 2013 that had fallen to 41 percent (Gallup). That was a real trend, and it held.
Another trend I flagged was craft beer, growing 7 percent in 2004 alone. It kept climbing for years, and by 2024 there were 9,612 craft breweries in the United States, double the number in 2015. But that year craft volume fell 4 percent, its third straight annual decline, and small independent breweries closed faster than new ones opened for the first time in twenty years, according to the Brewers Association (Axios). In hindsight, craft beer was an S-curve, and it has hit its ceiling.
The trend I would now frame differently was the rise of wine. Wine closed the gap with beer for a while, but in 2025 Gallup found beer still the most common choice among drinkers, at 38 percent, ahead of liquor at 30 and wine at 29, and only 54 percent of American adults said they drank at all, a record low (Deseret News, reporting Gallup). The bigger story turned out not to be beer losing to wine. It was alcohol losing to abstinence. Trend analysis caught the direction; it took twenty years of data to see the whole shape.
What to do when the data is thin
Some questions have little research behind them. On one food-trends project, I found plenty on the United States and almost nothing on Canada. Because the two markets were similar on the measures that mattered, such as obesity rates and diet-food consumption, I drew cautious conclusions from the American data, said so, and moved on. Do the best you can with the best available evidence, note its limits, and keep looking.
Frequently asked questions
What is trend analysis?
Trend analysis is the study of data that shows how something has changed over time, used to understand which changes are real, how fast they are moving and what they could mean for an organization.
How do you tell a trend from a fad?
Look for sustained change in measured data over several years, confirmed by more than one independent source. A fad shows up in headlines; a trend shows up in the data.
What are the best sources for trend research?
Official statistics and reports from government agencies, universities and international organizations, and peer-reviewed research. Use trade and popular media for leads, and verify advocacy figures independently.
Related reading
- How to use trend analysis for business strategy
- Systems Mapping for Strategy
- Strategic Foresight: A Practitioner’s Guide to Seeing What’s Coming
Competitive Futures researches trends and builds foresight studies for companies and governments; details are on the services page.