Trend data about the U.S. Government Shutdown
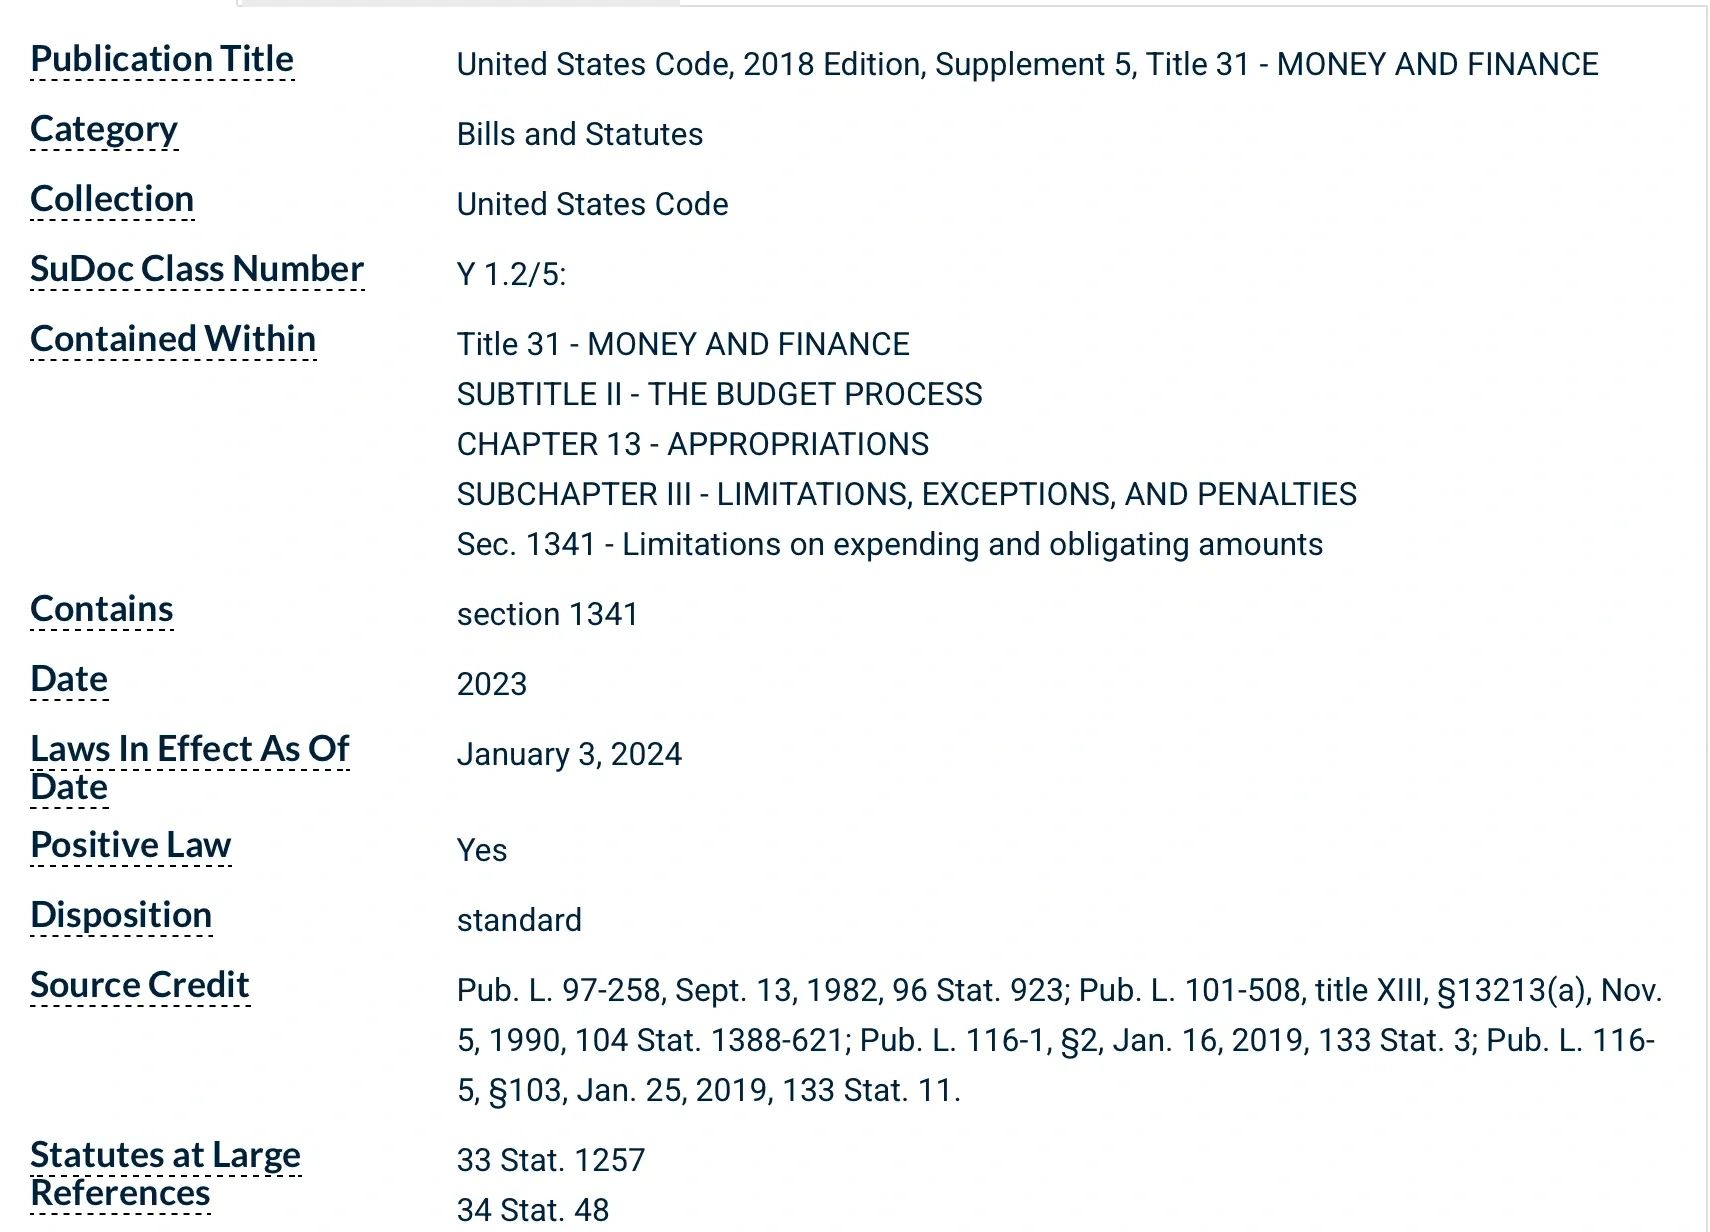
On or about September 30, 2025, the United States Congress failed to pass legislation which would fund U.S. Government operations. Under the Antideficiency Act, the Federal Government is prohibited from obligating or expending federal funds in advance or in excess of an appropriation, and from accepting voluntary services. If they violate this law, individual employees can be subject to administrative discipline, or they can even face fines or prison. 31 U.S.C. §§ 1341(a), 1342, 1517(a). Thus, there has been yet another U.S. Government shutdown.
But how many times has this occurred in recent history? What are some statistics around the government shutdown?
U.S. Government Shutdown Statistics
Since 1976, there have been a total of 21 U.S. Government shutdowns according to the Congressional Research Service.
- Ford Administration: September 30 to October 11, 1976 – 10 days
- Carter Administration: September 30 to October 13, 1977 – 13 days
- Carter Administration: October 31 to November 9, 1977 – 8 days
- Carter Administration: November 30 to December 9, 1977 – 8 days
- Carter Administration: September 30 to October 18, 1978 – 18 days
- Carter Administration: September 30 to October 12, 1979 – 11 days
- Reagan Administration: December 1 to December 3, 1981 – 2 days
- Reagan Administration: September 30 to October 2, 1982 – 1 day
- Reagan Administration: December 17 to December 21, 1982 – 3 days
- Reagan Administration: November 10 to November 14, 1983 – 3 days
- Reagan Administration: September 30 to October 3, 1984 – 2 days
- Reagan Administration: October 3 to October 5, 1984 – 1 day
- Reagan Administration: October 16 to October 18, 1986 – 1 day
- Reagan Administration: December 18 to December 20, 1987 – 1 day
- H.W. Bush Administration: October 5 to October 9, 1990 – 3 days
- Clinton Administration: November 14 to November 19, 1995 – 5 days
- Clinton Administration: December 16, 1995 to January 6, 1996 – 21 days
- Obama Administration: October 1 to October 17. 2013 – 16 days
- Trump Administration: February 9, 2018 – 1 day
- Trump Administration: January 20 to January 23, 2019 – 3 days
- Trump Administration: December 22, 2018 to January 25, 2019 – 34 days
The average duration of a U.S. government shutdown is 8 days.
Lest anyone think that shutdowns are purely partisan, the most shutdowns happened under House Speaker Tip O’Neill, who oversaw five shutdowns during the presidency of Democrat Jimmy Carter. Also, two of three shutdowns occurred under Trump while Paul Ryan was Speaker, with the longest shutdown, 34 days, occurring while Rep. Nancy Pelosi had the gavel.
While it is unknown how long the standoff will continue between Jeffries, Schumer, and Trump, history assures us that the situation is temporary.
For more information, consult the Congressional Research Service report on funding gaps.